S.M.A.R.T. Monitoring with Scrutiny across machines
The problem 🤔
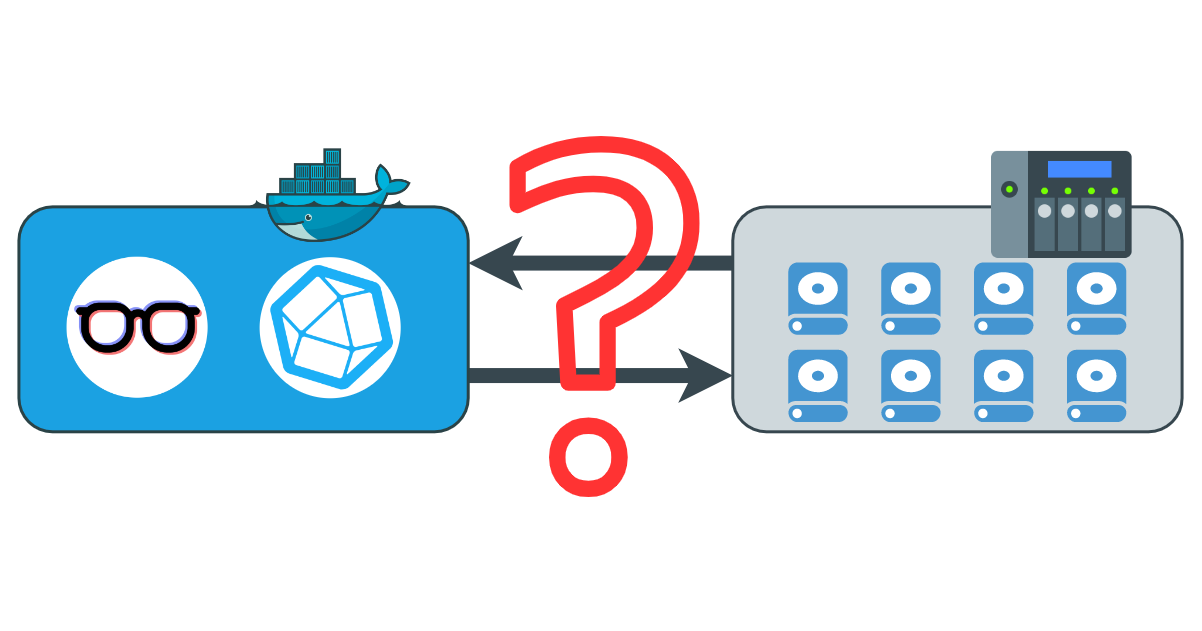
Scrutiny offers a nice Docker package called “Omnibus” that can monitor HDDs attached to the same Docker host with relative ease. What happens when those HDDs are on another machine? In this case Scrutiny can be installed in a Hub-Spoke layout where Web interface, Database and Collector are 3 separate containers. The official documentation assumes that the both the Hub and the Spokes will be run in Docker, which is not always the case. What happens when the spokes aren’t running Docker? How do you collect the data?
The solution 💡
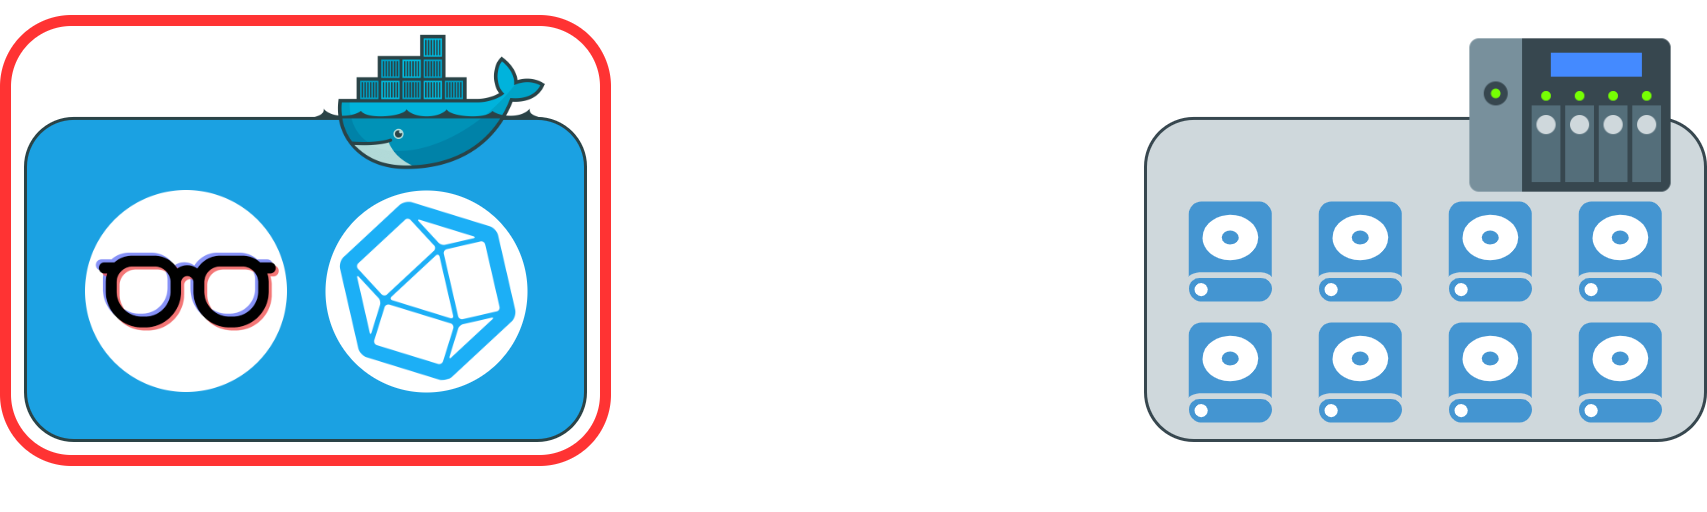
This tutorial provides a hybrid configuration where the Hub lives in a Docker instance while the Spokes have only the Collector installed as a binary. The Collector periodically sends data to the Hub. If you have multiple spokes, you can even mix Collectors that run in Docker and some that run as binaries. It’s not mind-boggling hard to understand but someone might struggle with the setup. This is for them.
My setup 🖥️
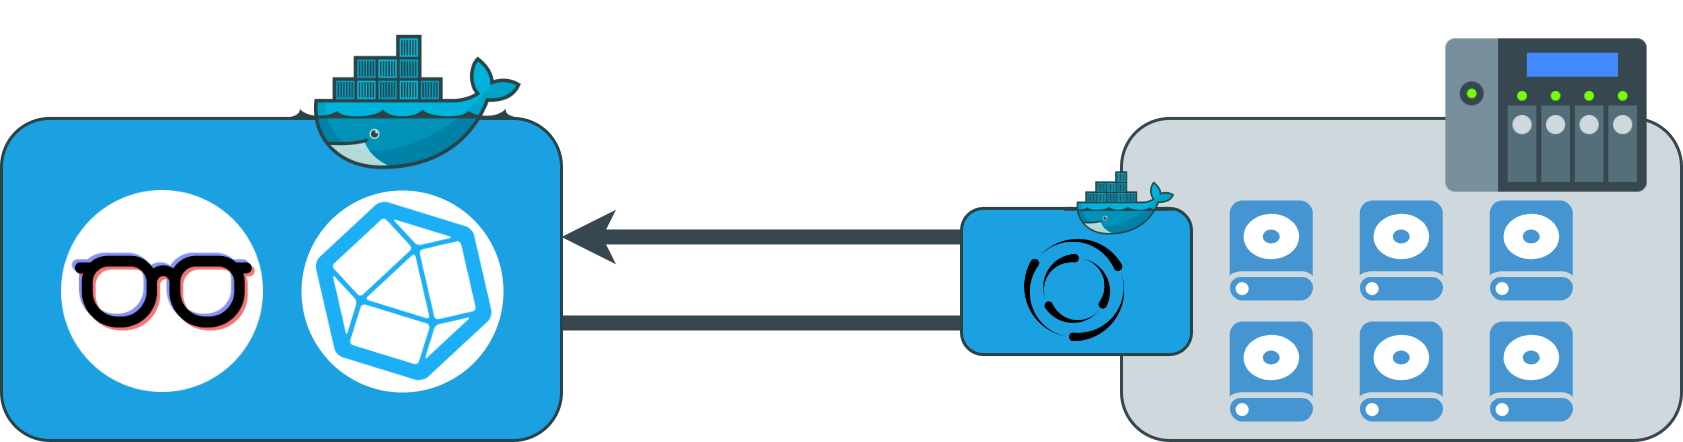
I have a Proxmox cluster where one VM runs Docker and all monitoring services - Grafana, Prometheus, various exporters, InfluxDb as containers. Another VM runs the NAS - OpenMediaVault v6, where all hard drives reside. The Scrutiny Collector binary on the OMV6 VM is triggered every 30min to collect data on the drives. The data is then sent to the Docker VM, running InfluxDB and Scrutiny Web.
Setting up the Hub
The Hub consists of Scrutiny Web - a web interface for viewing the SMART data. And InfluxDB, where the smartmon data is stored.
🔗This is the official Hub-Spoke layout in docker-compose. We are going to reuse parts of it. The ENV variables provide the necessary configuration for the initial setup, both for InfluxDB and Scrutiny.
If you are working with and existing InfluxDB instance, you can forgo all the INIT variables as they already exist.
The official Scrutiny documentation has a sample scrutiny.yaml file that normally contains the connection and notification details but I always find it easier to configure as much as possible in the docker-compose.
1
2
3
4
5
6
7
8
9
10
11
12
13
14
15
16
17
18
19
20
21
22
23
24
25
26
27
28
29
30
31
32
33
34
35
36
37
38
39
40
41
42
43
44
45
46
47
48
49
version: "3.4"

networks:
  monitoring:       # A common network for all monitoring services to communicate into
    external: true
  notifications:    # To Gotify or another Notification service
    external: true

services:
  influxdb:
    container_name: influxdb
    image: influxdb:2.1-alpine
    ports:
      - 8086:8086
    volumes:
      - ${DIR_CONFIG}/influxdb2/db:/var/lib/influxdb2
      - ${DIR_CONFIG}/influxdb2/config:/etc/influxdb2
    environment:
      - DOCKER_INFLUXDB_INIT_MODE=setup
      - DOCKER_INFLUXDB_INIT_USERNAME=Admin
      - DOCKER_INFLUXDB_INIT_PASSWORD=${PASSWORD}
      - DOCKER_INFLUXDB_INIT_ORG=homelab
      - DOCKER_INFLUXDB_INIT_BUCKET=scrutiny
      - DOCKER_INFLUXDB_INIT_ADMIN_TOKEN=your-very-secret-token
    restart: unless-stopped
    networks:
      - monitoring

  scrutiny:
    container_name: scrutiny
    image: ghcr.io/analogj/scrutiny:master-web
    ports:
      - 8080:8080
    volumes:
      - ${DIR_CONFIG}/scrutiny/config:/opt/scrutiny/config
    environment:
      - SCRUTINY_WEB_INFLUXDB_HOST=influxdb
      - SCRUTINY_WEB_INFLUXDB_PORT=8086
      - SCRUTINY_WEB_INFLUXDB_TOKEN=your-very-secret-token
      - SCRUTINY_WEB_INFLUXDB_ORG=homelab
      - SCRUTINY_WEB_INFLUXDB_BUCKET=scrutiny
      # Optional but highly recommended to notify you in case of a problem
      - SCRUTINY_WEB_NOTIFY_URLS=["http://gotify:80/message?token=a-gotify-token"]
    depends_on:
      - influxdb
    restart: unless-stopped
    networks:
      - notifications
      - monitoring
A freshly initialized Scrutiny instance can be accessed on port 8080, eg. 192.168.0.100:8080. The interface will be empty because no metrics have been collected yet.

Setting up a Spoke without Docker
A spoke consists of the Scrutiny Collector binary that is run on a set interval via crontab and sends the data to the Hub. The official documentation describes the manual setup of the Collector - dependencies and step by step commands. I have a shortened version that does the same thing but in one line of code.
1
2
3
4
5
6
7
8
9
10
11
# Installing dependencies
apt install smartmontools -y

# 1. Create directory for the binary
# 2. Download the binary into that directory
# 3. Make it exacutable
# 4. List the contents of the library for confirmation
mkdir -p /opt/scrutiny/bin && \
curl -L https://github.com/AnalogJ/scrutiny/releases/download/v0.5.0/scrutiny-collector-metrics-linux-amd64 > /opt/scrutiny/bin/scrutiny-collector-metrics-linux-amd64 && \
chmod +x /opt/scrutiny/bin/scrutiny-collector-metrics-linux-amd64 && \
ls -lha /opt/scrutiny/bin
When downloading Github Release Assests, make sure that you have the correct version. The provided example is with Release v0.5.0. The release list can be found here.
Once the Collector is installed, you can run it with the following command. Make sure to add the correct address and port of your Hub as --api-endpoint.
1
/opt/scrutiny/bin/scrutiny-collector-metrics-linux-amd64 run --api-endpoint "http://192.168.0.100:8080"
This will run the Collector once and populate the Web interface of your Scrutiny instance. In order to collect metrics for a time series, you need to run the command repeatedly. Here is an example for crontab, running the Collector every 15min.
1
2
3
4
5
# open crontab
crontab -e

# add a line for Scrutiny
*/15 * * * * /opt/scrutiny/bin/scrutiny-collector-metrics-linux-amd64 run --api-endpoint "http://192.168.0.100:8080"
The Collector has its own independent config file that lives in /opt/scrutiny/config/collector.yaml but I did not find a need to modify it. A default collector.yaml can be found in the official documentation.
Setting up a Spoke with Docker
Setting up a remote Spoke in Docker requires you to split the official Hub-Spoke layout docker-compose.yml. In the following docker-compose you need to provide the ${API_ENDPOINT}, in my case http://192.168.0.100:8080. Also all drives that you wish to monitor need to be presented to the container under devices.
The image handles the periodic scanning of the drives.
1
2
3
4
5
6
7
8
9
10
11
12
13
14
15
version: "3.4"

services:

  collector:
    image: 'ghcr.io/analogj/scrutiny:master-collector'
    cap_add:
      - SYS_RAWIO
    volumes:
      - '/run/udev:/run/udev:ro'
    environment:
      COLLECTOR_API_ENDPOINT: ${API_ENDPOINT}
    devices:
      - "/dev/sda"
      - "/dev/sdb"